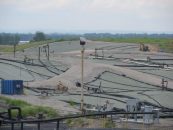
Missouri agencies are testing wastewater and sewer systems for traces of the COVID-19 virus as part of a new tracking project unveiled this week.
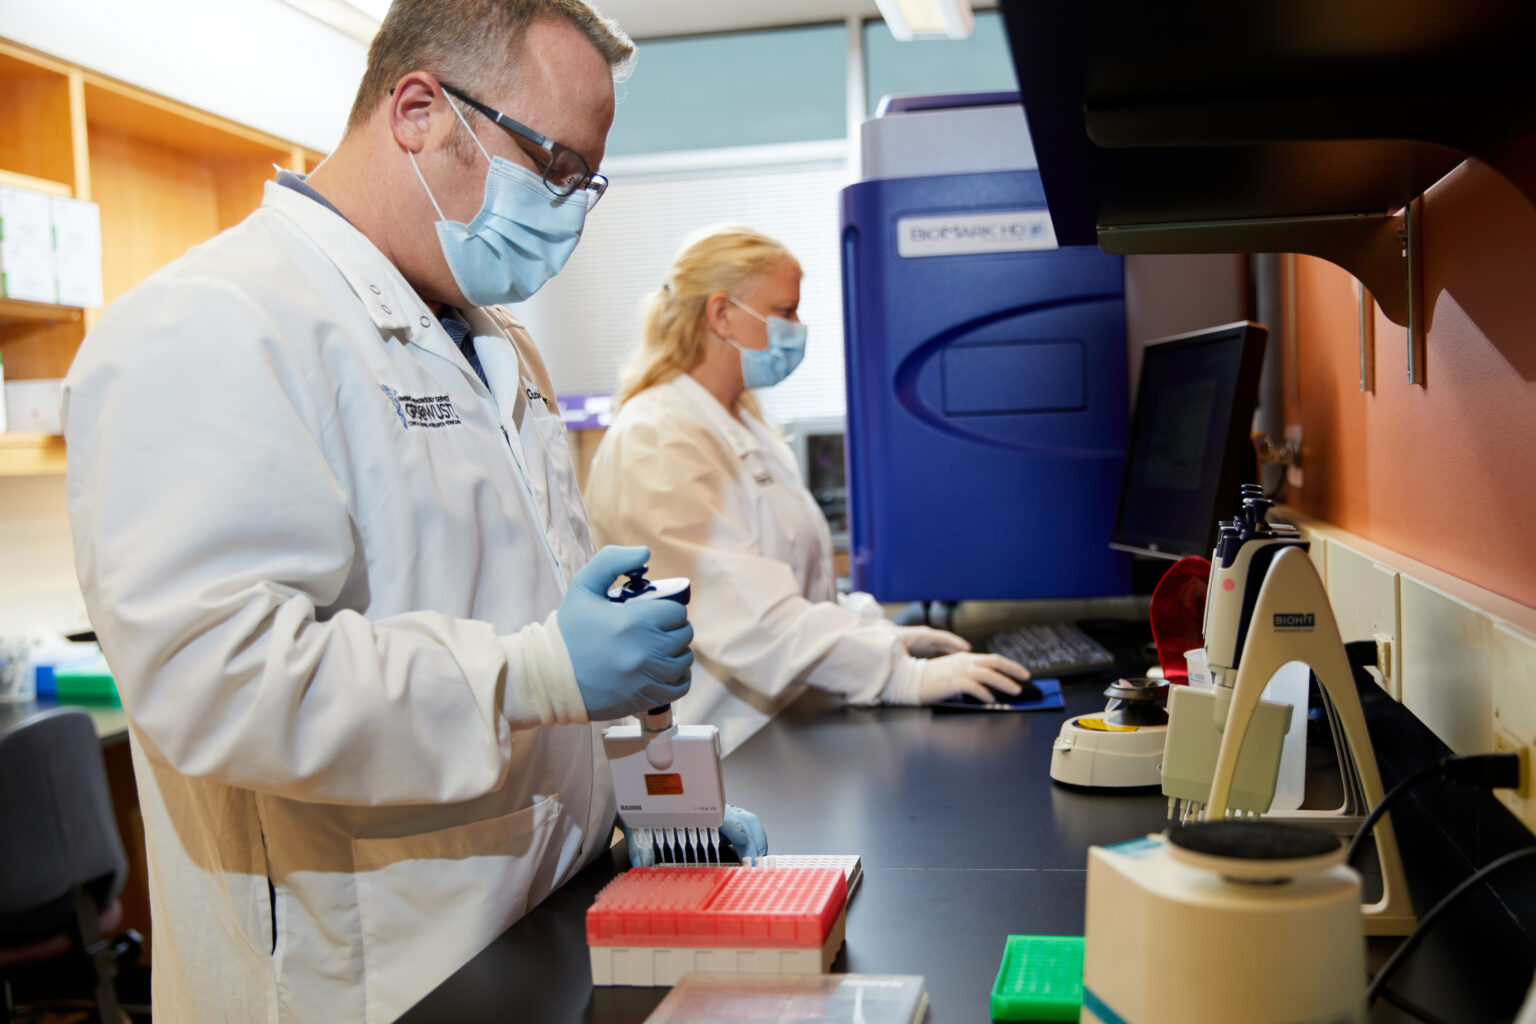
The project is a collaboration between the Department of Health and Senior Services (DHSS), Department of Natural Resources (DNR), and the University of Missouri (MU). The program monitors trends of the virus in communities by examining the amount of viral genetic material in wastewater, which can be measurable before people begin to show symptoms. The data is compiled on the DHSS website.
According to DHSS Bureau of Environmental Epidemiology Chief Jeff Wenzel, the idea came from similar practices used across the world.
“We heard about work that was being done in the Netherlands very similar to this. They were taking wastewater samples and testing them for COVID-19 and trying to determine what they could do with those results,” Wenzel told The Missouri Times. “We decided to do something similar, so we partnered with MU and DNR to do a similar analysis here in Missouri, and we collected our first samples in May from nine locations just to see if we could produce results.”
Samples are collected weekly from wastewater treatment plants, and the data is scaled based on the change from one week to the next. Trends are considered to be “increasing” if the viral load increased by 40 percent or more over the last week or 25 percent over the past two; “no change” indicates a steady rate from one week to the next; and “decreasing” denotes a decrease of 40 percent or more over a three-week span. Health officials work with scientists to monitor the data and respond to outbreaks where they are found.
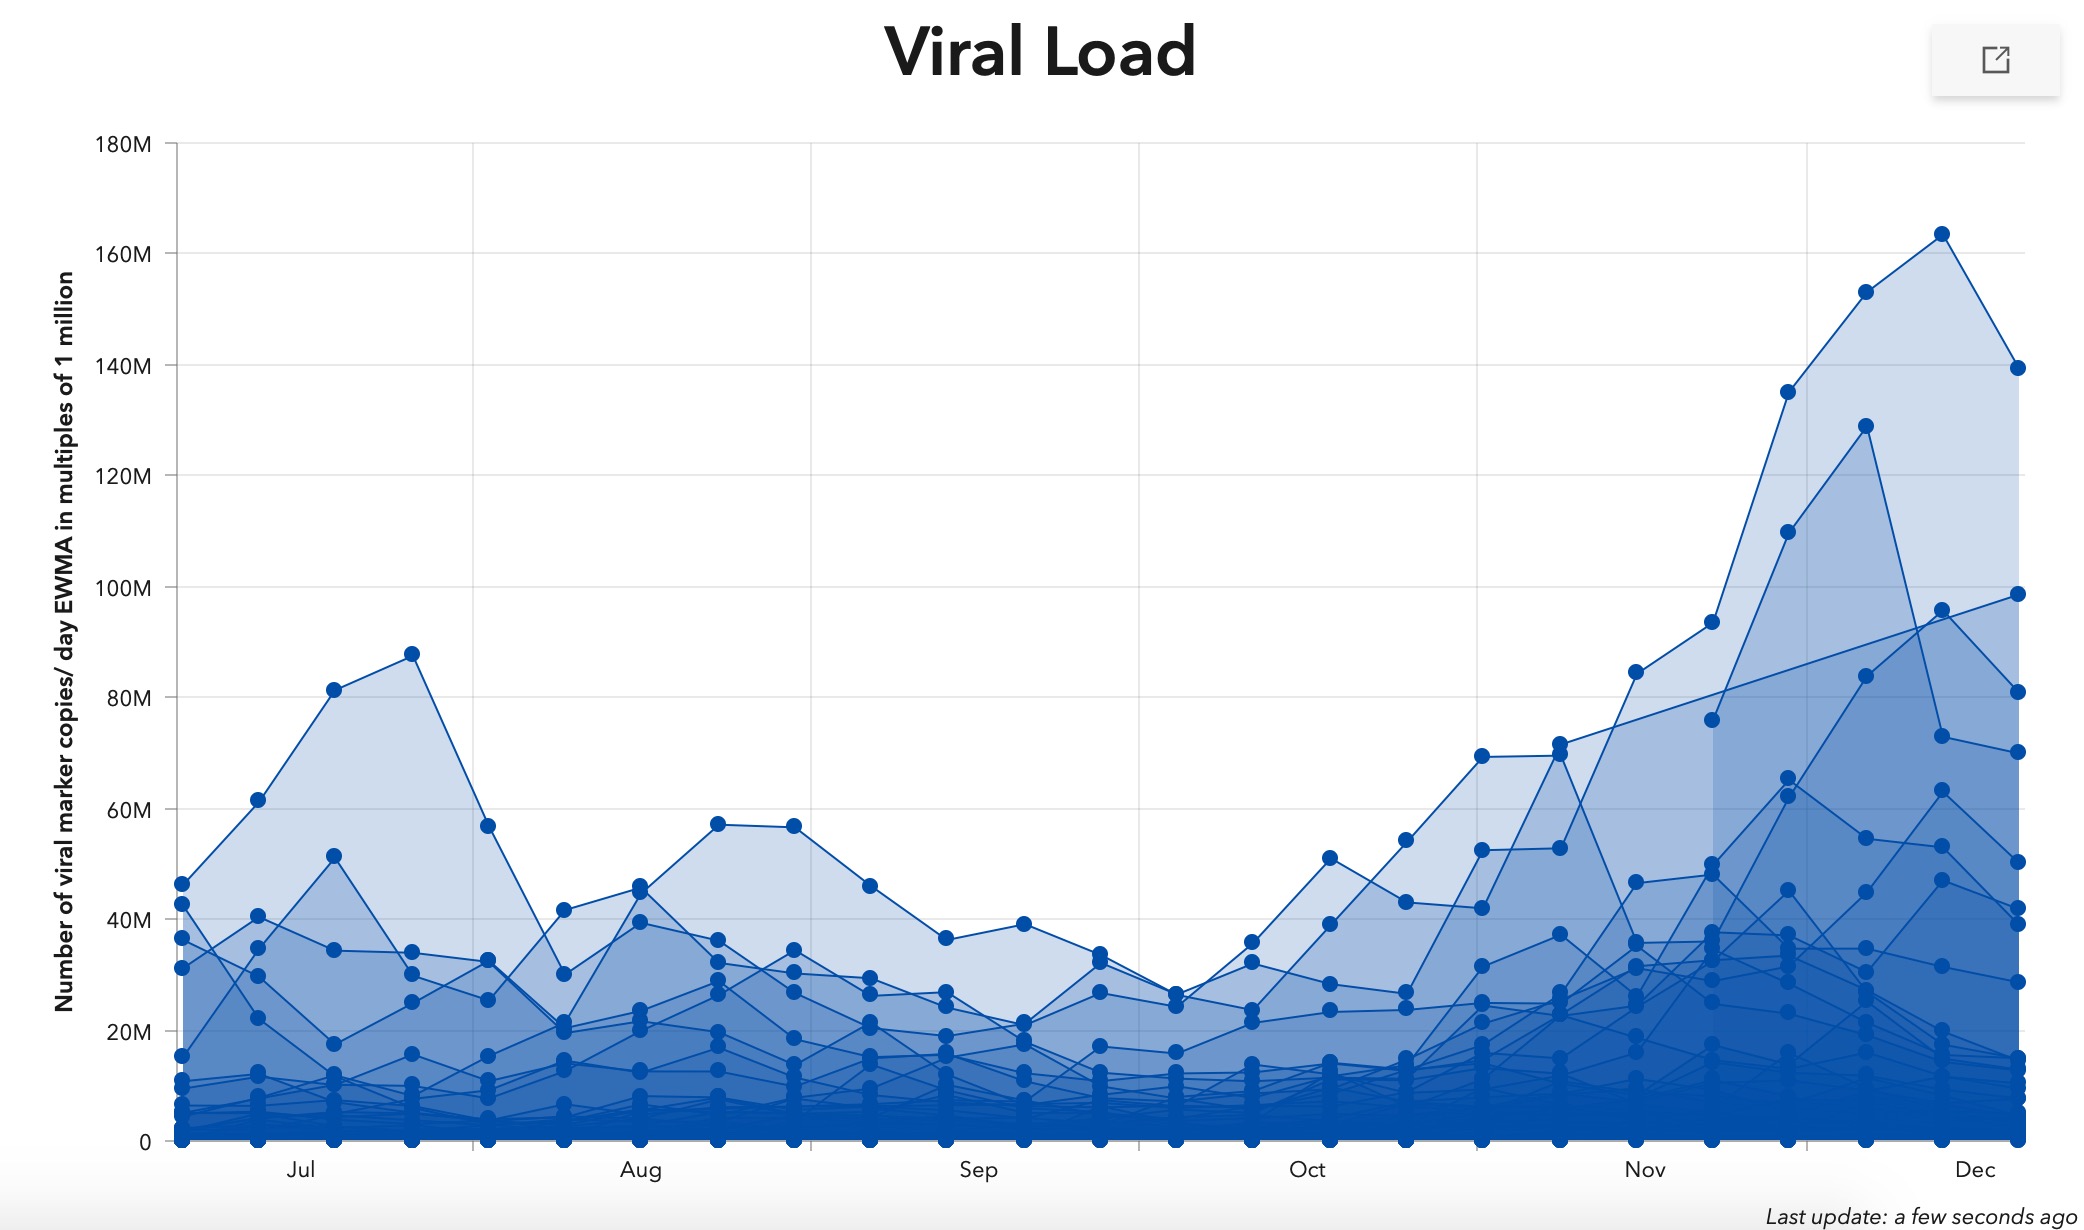
“We’re now up to 59 community locations tested weekly, and we have enough information to do an analysis of the data and start learning from it to make predictions,” he said. “We found if there’s a large increase in the viral load in a sewer system that we see a noticeable increase in the number of individuals that test positive in that sewer-shed 70 percent of the time.”
While it cannot determine the exact number of infections, he said the data can illustrate the levels of infection in a particular area and trends within the community. Wenzel also noted an increase in viral levels may not always indicate an increase in clinical cases, nor is it meant to be used as the only indicator of COVID-19 rates.
“There are a lot of different factors that go into that 70 percent — the amount of flow or rainwater, variables that we can measure and account for,” he said. “Something we’re not able to account for would be changes in population movement due to events or individual’s patterns, or the percent of the population getting tested. The data we collect just points us towards possible major changes and 70 percent of the time it leads to accurate results.”
Wenzel said the tracker will be updated as new data is collected weekly. The interactive data map can be viewed here.
Cameron Gerber studied journalism at Lincoln University. Prior to Lincoln, he earned an associate’s degree from State Fair Community College. Cameron is a native of Eldon, Missouri.
Contact Cameron at cameron@themissouritimes.com.